Reading about dragons. Exploring the most popular genres on Goodreads
 Image credit: giphy
As a lover of fantasy (and dragons) and a keen Goodreads user, for this project I wanted to explore the top genres for fiction and non-fiction and draw comparisons to my own reading habits.
I wanted to explore a datasetsthat would help me answer the following questions:
- What are the most popular genres?
- What are the highest rated books?
Data Collecting
I used the following dataset from kaggle.com:
- Top Goodreads Books (1980-2023): https://www.kaggle.com/datasets/cristaliss/ultimate-book-collection-top-100-books-up-to-2023
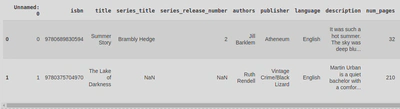
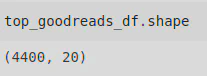
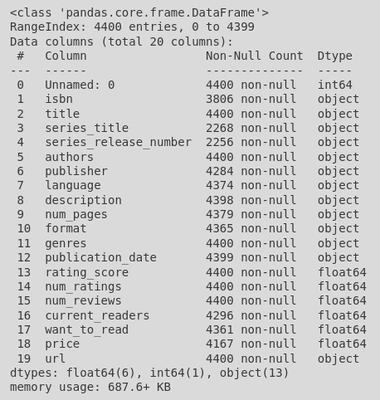
This dataset looked at the top 100 books for each year between 1980 and 2023, according to Goodreads, and includes genres, book length, average rating, and the number of people interested in reading each book. It is made up of 4400 indexes and 20 columns.
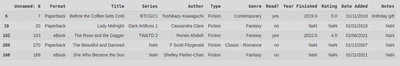
- Personal dataset:
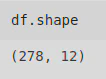
This dataset is created from my own personal library spreadsheet which documents my physical and electronic book collection as well as some details about each book (e.g. whether I have read it and what genre it is). It is made up of 278 indexes and 12 columns.
Importing Libraries
For this project, I imported the following Python libraries:
import pandas as pd
import numpy as np
from matplotlib import pyplot as plt
import seaborn as sns
I then called the .read_csv() method so that I could turn my dataset into a DataFrame, and explored the dataset so that I could clean, checked if anything needed to be amended or removed, looked for NaNs, and got to cleaning.
Data Cleaning
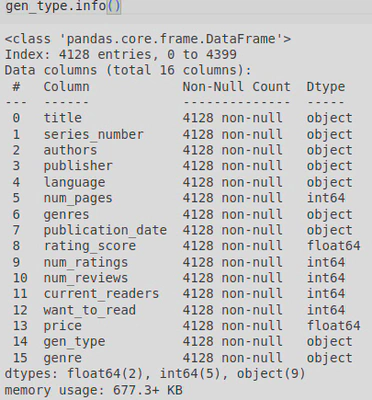
By calling the .info() method on this DataFrame, I was able to identify some things that needed cleaning:
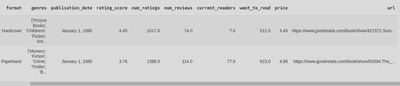
Firstly, there were several columns I wasn’t interested in, for example the description and goodreads url for each book weren’t relevant for the questions I wanted to answer.
So I dropped these columns using the following code:
cols_to_drop2 = ['Unnamed: 0', 'isbn', 'series_title', 'description','format', 'url']

goodreads_clean_df = top_goodreads_df.copy() #tracking changes
goodreads_clean_df = goodreads_clean_df.drop(cols_to_drop2, axis=1)
I also had some columns that should have been integers but were instead float or object types. To address this, I created a list named num_cols containing the columns I wanted to convert:
num_cols = ['num_pages' ,'current_readers', 'want_to_read', 'num_ratings', 'num_reviews']
I then passed my list into the DataFrame and called the .astype() method.
goodreads_clean_df[num_cols] = goodreads_clean_df[num_cols].astype(int)
However, here I encountered the following ValueError:
ValueError: invalid literal for int() with base 10: '290 page'
As it turned out, the values in the num_pages column sometimes included the word ‘pages’, as became clear when I called the .unique() method on the column.
To combat this, I created the following function to check for the word ‘pages’ in the num_pages values.
def convert_to_int(x):
  try:
    return int(x.replace(' pages',''))
  except:
    return int(x)
If my function found the word in a value, it would remove it (by replacing it with empty space) and cast the string to an integer. When the word wasn’t found, my function would simply cast the string to integer. In order to do this I had to use the .apply() method to call my function:
goodreads_clean_df['num_pages'] = goodreads_clean_df['num_pages'].apply(convert_to_int)
As a result, the values of num_pages became integers and I was able to rerun my earlier code (excluded ’num_pages’) to turn num_cols = [‘current_readers’, ‘want_to_read’, ’num_ratings’, ’num_reviews’] into integers.
Next I removed some duplicates by calling the .drop_duplicates() method:
unique_goodreads = goodreads_clean_df.drop_duplicates(subset=['title'])
This worked by checking for duplicated title names (by checking the title column) and dropping (i.e. removing) repeated names. By default .drop_duplicates() keeps the first occurrence of the title.
I then called .info() to checked the data types had been changed.
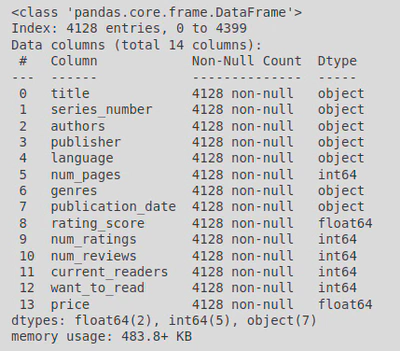
And took a look at my clean DataFrame: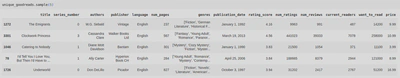
Genres
Next, I needed to do something about the genres column as each value was made up of a list-like object data type like this: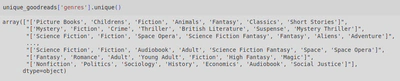
To address this, I first created a copy of my DataFrame and used the .str.extract() method to create a new column (called gen_type) that would differentiate fiction from non-fiction:
genre_type = unique_goodreads.copy()
genre_type['gen_type'] = genre_type['genres'].str.extract(r'(Fiction|Nonfiction)')
This worked by extracting the string (.str) ‘Fiction’ or ‘Nonfiction’ from the genres column and then adding it to the new column, with the help of regular expression (represented by ‘r’) to allow me to find ‘Fiction’ OR ‘Nonfiction’ (rather than the presence of both at once).
Following this I needed to created a new genre column, assigning only one genre to each books as that would be more manageable than 7 genres per book.
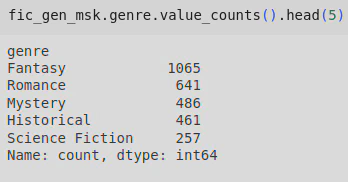
Using the .value_counts() and .head() methods I determined which genres I wanted to use - I identified more generalised genres from the top 20 most common arrays, excluding fiction or non-fiction.
top_genres_df = genre_type.copy()
top_genres_df['genre'] = top_genres_df['genres'].str.extract(r'(Fantasy|Mystery|Thriller|Graphic Novels|Comics|Romance|Historical Fiction|\
              Historical|History|Crime|Science Fiction|Science|Biography|Classics|Self Help|Feminism|\
              Horror|Comedy|Humor|Politics|Poetry|Contemporary|Picture Books|Religion)', expand=False)
I also ignored any age specific words (such as childrens or young adult) as I felt they were too vague (age specific words were grouped with anything from fantasy to mystery) and I wanted to look at more typical genres (e.g. Fantasy, Romance, True Crime’ etc).
‘Historical Fiction’ and ‘History’ were renamed as ‘Historical’ in order group them using .replace() on the series.
top_genres_df['genre'] = top_genres_df['genre'].replace('Historical Fiction', 'Historical')
top_genres_df['genre'] = top_genres_df['genre'].replace('History', 'Historical')
Likewise, I also renamed Humor as Comedy, and Comics as Graphic Novels, to join the genres.
top_genres_df['genre'] = top_genres_df['genre'].replace('Humor', 'Comedy')
top_genres_df['genre'] = top_genres_df['genre'].replace('Comics', 'Graphic Novels')
Alternatively, I could have used a dictionary to map the old genre names to new ones and pass the dictionary to the .replace() method:
replace_genres = {'Historical Fiction':'Historical',
               'History':'Historical',
               'Humor':'Comedy',
               'Comics':'Graphic Novels'
               }
top_genres_df['genre'] = top_genres_df['genre'].replace(replace_genres)
Whilst building my generalised list of genres, to ensure that I categorised all books, I called the .isna() method against the series I was creating, genre. Once I had accounted for the majority of books in the dataset, the more obscure genres were transformed into ‘Other’ using .fillna().
top_genres_df['genre'] = top_genres_df['genre'].fillna('Other')
top_genres_df.head()
Next I utilised .isna() to check for NaNs in the gen_type column. I then reassigned any books that were clearly fiction (or non-fiction) to the correct gen_type value, and Googled a few I wasn’t sure about. After I was finished I called .info() on my DataFrame to check all NaNs had been dealt with.
1. What are the most popular genres?
To answer this question, I first created a series of my genres and their unique count (i.e. number of occurrences of each genre) by calling the .value_counts() method, and called it gen_count.
gen_count = goodreads_df.genre.value_counts()
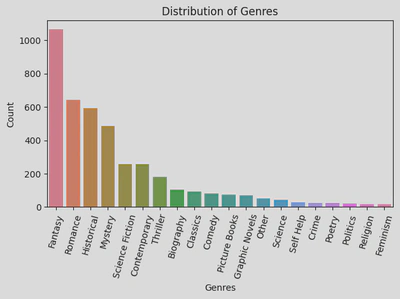
Then I plotted a bar graph using the following code:
sns.barplot(x=gen_count.index, hue=gen_count.index, y=gen_count.values, palette='husl')
plt.title('Distribution of Genres')
plt.xlabel('Genres')
plt.ylabel('Count')
plt.xticks(rotation=75)
plt.tight_layout()
plt.show()
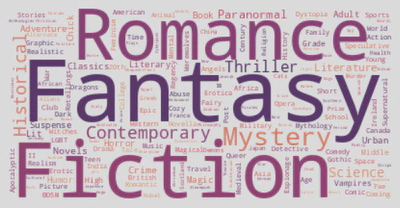
The following bar graph indicates that the most popular genre, by far, was Fantasy. The least popular were Feminism, Religion, and Politics.
However, I wanted to dive further and so I proceeded to separate fiction from non-fiction.
Starting with non-fiction, I created a mask (nf_gen_msk) to filter my DataFrame by the gen_type ‘Nonfiction:
nf_gen_msk = goodreads_df[goodreads_df['gen_type'] == 'Nonfiction']
I than turned my DataFrame into a series called nf_gen_count and applied my mask to it. This produced a series of genres and their count, filtered by non-fiction.
nf_gen_count = nf_gen_msk['genre'].value_counts()
I was then able to create a bar graph using the following code:
sns.barplot(x=nf_gen_count.index, hue=nf_gen_count.index, y=nf_gen_count.values, palette='husl')
plt.title('Non-Fiction Genres')
plt.xlabel('Most Popular Genres')
plt.ylabel('Count')
plt.xticks(rotation=75)
plt.tight_layout()
plt.show()
However, I wanted to check on some of the genres in my plot as at first glance they looked incorrectly labelled as non-fiction. To do this I filtered my DataFrame by the non-fiction gen_type:
nf_type = nan_gen_type[nan_gen_type['gen_type'] == 'Nonfiction']
Next I filtered by genre. I checked the following genres within non-fiction: ‘Graphic Novels’, ‘Crime’, ‘Politics’, ‘Classics’, ‘Childrens’, and ‘Horror’. Then I called the .unique() method on the genre column of my filtered DataFrame to extract the original genres.
type_check = nf_type[nf_type['genre']=='Graphic Novels']
type_check['genres'].unique()
This allowed me to verify that they were all correctly labelled as non-fiction by producing the following output: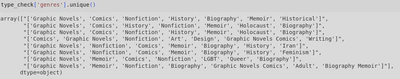
I was then able to plot my bar graph, illustrating the non-fiction genres:
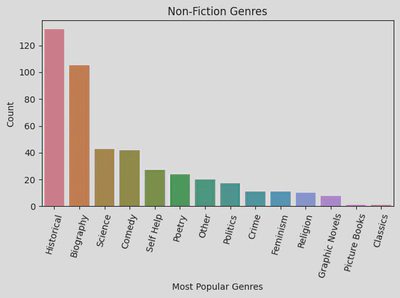
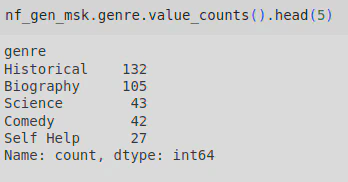
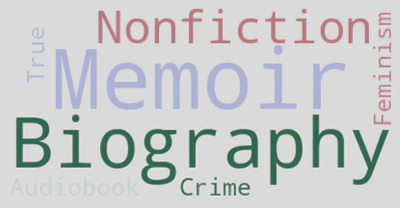
This indicates that the most popular non-fiction genre was Historical, followed by Biography.
The top 5 non-fiction genres are:
Similarly to the non-fiction genres, I also checked some of the fiction genres (e.g. ‘feminism’), but again they were correctly labelled.
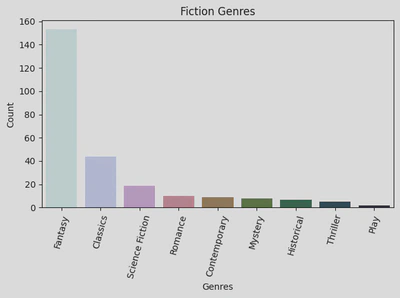
The following bar graph illustrates the top fiction genres:
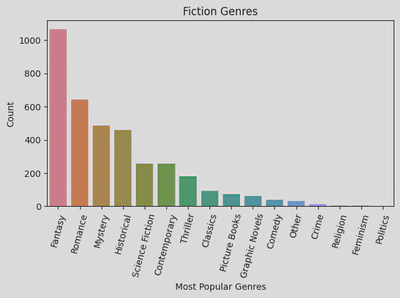
As you can see, the most popular genre for fiction was Fantasy.
The top 5 fiction genres are:
In both instances I can’t comment on the least popular genres as the original dataset was only looking at the top 100 books every year between 1980-2023, and therefore it’s possible that the least popular genres weren’t included. However, of the dataset I do have, I can see that Classics and Picture Books were the least popular Non-Fiction genres. Similarly, for fiction, the least popular genre was Politics, followed by Feminism, and Religion.
2. What are the highest rated books?
To address this question, I first sorted my DataFrame by the rating_score column, in descending order.
ordered_ratings_df = goodreads_df.copy().sort_values(by='rating_score', ascending=False)
ordered_ratings_df.head()
As a result, I was able to check the highest (.head()) and the lowest (.tail()) ratings - these were 4.81 and 2.97, respectively. The reason the lowest rating wasn’t 0 or 1 is that the dataset was looking at the top 100 books (per year), therefore I wouldn’t expect such a low rating. Though it would have been interesting to see what the lowest rated books were.
Building on this, I separated fiction from non-fiction so that I could find the highest (and lowest) rated books per genre type. I did this by creating a mask for non-fiction and passing my gen_type series through it to produce a DataFrame of non-fiction only books.
nf_ratings_msk = ordered_ratings_df[ordered_ratings_df['gen_type'] == 'Nonfiction']
nf_ratings_msk
This allowed me to produce a DataFrame of the top 10 non-fiction ratings and the corresponding book titles.
pd.set_option('display.max_colwidth', None) #sets max column width to none
nf_ratings_msk[['title', 'authors' ,'rating_score']].head(10)
Next, I created a horizontal bar graph showing the 10 highest rated non-fiction books.
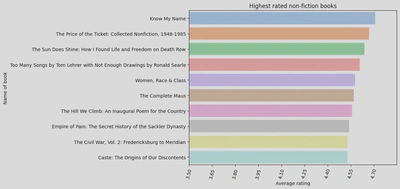
The highest rated book in non-fiction was ‘Know My Name’ by Chanel Miller, with a rating of 4.71.
As with non-fiction, I created a mask for fiction and produced a DataFrame of fiction books, organised by ratings.
I then plotted the 10 highest rated fiction books on a bar graph.
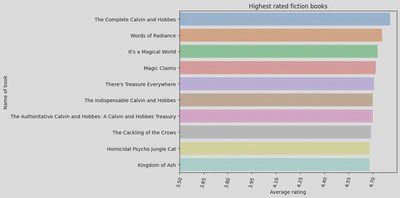
The highest rated book in fiction was ‘The Complete Calvin and Hobbes’ by Bill Watterson, with an average rating of 4.81

Me, myself, and I:
Now the fun part, how does all this reflect my own reading habits?
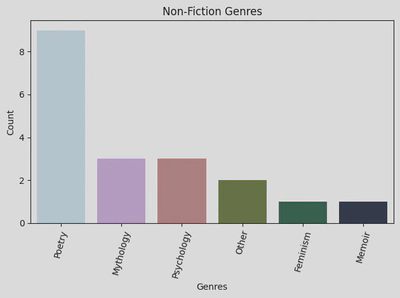
As you can see, my personal collection has significantly fewer non-fiction genres, with Poetry being my most popular non-fiction genre.
In the case of fiction, my tastes start to align with those of Goodreads, at least when it come to Fantasy. Turns out the majority of Goodreads (according to the dataset I used) and I are fans of dragons and the fantastical! 🐉
Conclusions
The most popular genre in fiction is fantasy
The most popular genre in non-fiction is historical
The highest rated book in non-fiction was ‘Know My Name’
The highest rated book in fiction was ‘The Complete Calvin and Hobbes’

Aftermath - What did I learn?
This project provided me with the opportunity to delve into various genres within fiction and non-fiction literature. It enabled me to hone my plotting skills, using Seaborn and Matplotlib, exploring a topic that deeply interests me. And most important, I discovered that Fantasy (my personal favourite) is the most popular genres. 🐲
Even though I ultimately didn’t apply it, I did learn about .explode(). This method can transform list-like elements (e.g. the genre lists in the original genres column of my dataset) into separate rows, where each element of the list occupies its own row. I also learnt about Pandas .set_option(‘display.max_colwidth’, None) function which allowed me adjust the display settings to avoid truncation so that I could see the full title of books.
And finally, I learnt that there are a multitude of possibilities and adjustments available when working on a project - from customising plots, to selecting the data visualisation techniques to use, or determining which column(s) to focus on. Having a good idea of what you are actually interested in also helps immensely, and recognising that there is never just one way to do approach a task.